
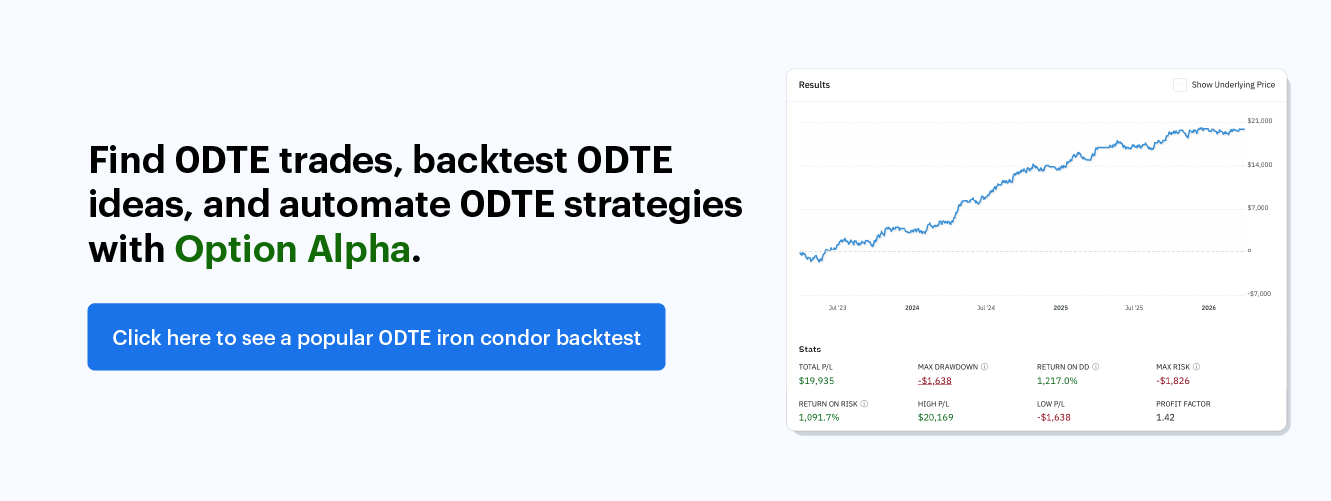
Have an idea for an options strategy? Great! Setup your strategy, including entry and exit filters, and run a new 0DTE or next day backtest using 1-minute historical options data.
Once the backtest is done running you'll see the performance history, including a breakdown of every backtested position, critical stats, monthly P/L returns, and detailed trade logs.
Quickly spin up new variations to view side-by-side and see how different variables, trade management, or entry/exit timing impacts the performance of your strategy.
Combine the results of up to four backtests into one portfolio P/L curve to simulate what a group of options strategies could do if traded together at one time.
Take any backtest you love and instantly create a bot that automatically trades the strategy for you using the exact details and settings you already backtested.


Yes, there are no limits to backtesting features during your trial. You'll have the ability to kick all the tires and test everything you want during your trial period.
Yes, all backtesting for 0DTE and 1DTE uses 1 min historical options data.
Yes, you can compare multiple backtests at once as well as create new variations of any existing backtest to test new ideas. Plus, you combine multiple backtests to see a portfolio P/L for the strategies running concurrently.
Unlimited. There are no limitations on how many backtests you can run.
Yes, you can include technical indicators within your backtests.
Yes, 100%. We built our own paper trading engine so you can paper trade as much as you want right inside Option Alpha without having to connect to a brokerage. Paper trading allows you to test your bot’s automation logic risk-free, in real-time, with live market conditions. Plus, you leverage the power of bots to test limitless strategies, ideas, and portfolio combinations so you're comfortable with autotrading before you start trading live.
Yes, you can cancel at any time and there are never any contract commitments. In fact, you have control to cancel your account directly from your account settings.
We offer a clear refund policy for our traders. This is on top of our full-featured 30-day free trial. Your subscription remains active for the remainder of your paid billing period. Annual plans are refundable within 7 calendar days of an automatic renewal billing.
We understand that things change. Rest easy knowing there are never any contracts or commitments, and you can cancel at any time. In fact, we make it easy to cancel your subscription with one-click inside your billing profile.
Yes, you can try Option Alpha completely free for 30 days. During your trial you'll have a chance to kick the tires on every part of the platform so you can make the best decision. Plus, there's no credit card required to sign up.
SPX, SPY, QQQ, IWM & XSP are supported for backtesting.
tastytrade, TradeStation, Tradier, and Charles Schwab are integrated and supported brokers. If you want access to a different broker, please request an integration with your favorite broker using the links on the Broker Integrations page. We will continue to announce new agreements with additional brokerages as they are signed and confirmed.


'%3e%3cg id='Final-Copy-2_2_' transform='translate(1275.000000, 200.000000)'%3e%3cpath class='st0' d='M7.4,12.8h6.8l3.1-11.6H7.4C4.2,1.2,1.6,3.8,1.6,7S4.2,12.8,7.4,12.8z'/%3e%3c/g%3e%3c/g%3e%3c/g%3e%3cg id='final---dec.11-2020'%3e%3cg id='_x30_208-our-toggle' transform='translate(-1275.000000, -200.000000)'%3e%3cg id='Final-Copy-2' transform='translate(1275.000000, 200.000000)'%3e%3cpath class='st1' d='M22.6,0H7.4c-3.9,0-7,3.1-7,7s3.1,7,7,7h15.2c3.9,0,7-3.1,7-7S26.4,0,22.6,0z M1.6,7c0-3.2,2.6-5.8,5.8-5.8 h9.9l-3.1,11.6H7.4C4.2,12.8,1.6,10.2,1.6,7z'/%3e%3cpath id='x' class='st2' d='M24.6,4c0.2,0.2,0.2,0.6,0,0.8l0,0L22.5,7l2.2,2.2c0.2,0.2,0.2,0.6,0,0.8c-0.2,0.2-0.6,0.2-0.8,0 l0,0l-2.2-2.2L19.5,10c-0.2,0.2-0.6,0.2-0.8,0c-0.2-0.2-0.2-0.6,0-0.8l0,0L20.8,7l-2.2-2.2c-0.2-0.2-0.2-0.6,0-0.8 c0.2-0.2,0.6-0.2,0.8,0l0,0l2.2,2.2L23.8,4C24,3.8,24.4,3.8,24.6,4z'/%3e%3cpath id='y' class='st3' d='M12.7,4.1c0.2,0.2,0.3,0.6,0.1,0.8l0,0L8.6,9.8C8.5,9.9,8.4,10,8.3,10c-0.2,0.1-0.5,0.1-0.7-0.1l0,0 L5.4,7.7c-0.2-0.2-0.2-0.6,0-0.8c0.2-0.2,0.6-0.2,0.8,0l0,0L8,8.6l3.8-4.5C12,3.9,12.4,3.9,12.7,4.1z'/%3e%3c/g%3e%3c/g%3e%3c/g%3e%3c/g%3e%3c/svg%3e) Your Privacy Choices
Your Privacy Choices