Option Alpha now offers a way to extend the functionality of bot automations. There are an infinite number of ways traders can trigger an automation in any bot using inbound webhooks.
The best part? This functionality is free for all OA users, available at no additional cost as long as you have an OA subscription.
Today, we’re going to explore how it’s possible to expand OA’s capabilities with a custom Python script using data from Tradier’s Market Data API. We’ll show you how to pull the last month’s closing values for SPY, calculate a custom Linear Regression Slope indicator, and trigger an automation to either go long or short a position in SPY through webhooks.
Motivation for writing this article
I love scripting in Python. Our production codebase is written in Node.js, but for any ancillary tasks that need to be performed, data that needs to be crunched, or visualizations that need to be created, I do them in Python because it’s where I’m most comfortable.
So, naturally, when the idea of introducing webhooks to Option Alpha became a reality, I started thinking about how I would use it as a consumer of this platform to make it truly extensible. Unsurprisingly, I settled on using Python to perform some tasks not currently possible inside of the platform.
As an OA developer, I can tell you the landscape of technical indicators is too vast to write all of them, support all of them, and make every technical trader happy. One of those indicators I always found intriguing but doesn't exist yet in OA is called Linear Regression Slope. I’ve always wanted to create a strategy to trade with it.
Today, I’m willing to give it a shot and show you how to do it. Let’s go!
Linear Regression Slope and Slope Angle
Linear regression is a statistical method used to model the relationship between a dependent variable and one or more independent variables by fitting a linear equation to observed data.
The linear regression slope, which is often denoted as “m” in the equation y = mx + b, represents the rate of change of the dependent variable with respect to the independent variable.
It indicates how much the dependent variable is expected to increase (or decrease) for a one-unit increase in the independent variable. Mathematically, the slope is calculated as the ratio of the covariance of the variables to the variance of the independent variable, effectively capturing the direction and steepness of the line of best fit.
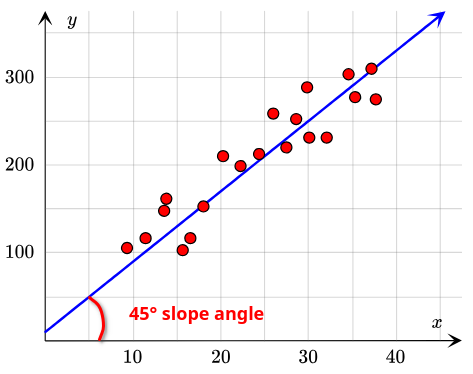
The slope angle, on the other hand, is a geometric interpretation of the linear regression slope. It is the angle formed between the regression line and the x-axis. This angle can be computed by taking the arctangent (inverse tangent) of the slope value, which gives the angle in radians.
Converting this angle from radians to degrees provides a more intuitive understanding of the line's orientation.
The slope angle provides insight into the steepness and direction of the relationship: a positive angle indicates an upward trend, while a negative angle indicates a downward trend. Or, in trading terms, a potential opportunity to go long or short.
If we can determine the slope angle for a series of a security’s daily closing values, we may be able to enter an options position in the direction of the trend.
Retrieving Closing Prices from Tradier’s Market Data API
Our Tradier brokerage account comes with a phenomenal API we can use to retrieve market data. I’m interested in trading SPY, the S&P 500 ETF, so let’s use the requests library to pull the last 30 trading days or so for our graph.
Note that the following code is used for demonstration purposes only and is written concisely for ease of display and understanding. This code does not include adequate error handling.
import requests

# visit https://dash.tradier.com/settings/api to retrieve your API access token
API_KEY = 'my-secret-key';

headers = {
    'Authorization': f'Bearer {API_KEY}',
    'Accept': 'application/json'
}

# End date our data request is today
end_date = datetime.today().strftime('%Y-%m-%d')

# Start date is 45 calendars in the past, or approximately 30 trading days
start_date = (datetime.today() - timedelta(days=45)).strftime('%Y-%m-%d')

# Fill in the parameters for our data request
params = {
    'symbol': ticker,
    'interval': 'daily',
    'start': start_date,
    'end': end_date,
    'session_filter': 'all'
}

# Pull data from Tradier
history = requests.get('https://api.tradier.com/v1/markets/history', params=params, headers=headers)

# Parse the JSON response into a list of daily bars
bars = history.json().get('history', {}).get('day', [])

# Pull only the close price for each day in the bars list
closing_prices = [day.get('close') for day in bars if day.get('close')]
Great! We’ve got our data–a list of closing values for approximately the last 30 trading days. Now it’s time to figure out how to calculate our linear regression slope and slope angle.
Using SciPy to calculate linear regression
To efficiently calculate the linear regression line, slope, and slope angle we need to import a few libraries. Instead of reinventing the wheel, we’ll use the SciPy library along with the NumPy and Math libraries to calculate it in just a few lines of code.
Since we’re most likely going to reuse this functionality, let’s define a function to calculate it.
We’re going to calculate the Linear Regression Slope and Slope Angle for an array (or list, in Python vernacular) of floating point values. I’d like this function to return the slope, the slope angle in degrees, and the y-intercept, which I’ll need to plot this on a graph later.
import math
import numpy as np

from scipy.stats import linregress

def linear_regression_slope(values):
    # Check if the input has at least two values to perform linear regression
    if len(values) < 2:
        raise ValueError("At least two values are required to calculate the slope.")

    # Generate an array of x-values representing the indices of the input values
    x = np.arange(len(values))

    # Convert the input values to a numpy array
    y = np.array(values)

    # Perform linear regression on the x and y values
    # linregress returns several values: slope, intercept, r_value, p_value, and std_err
    slope, intercept, r_value, p_value, std_err = linregress(x, y)

    # Calculate the slope angle in radians using the arctangent function
    slope_angle_radians = math.atan(slope)

    # Convert the slope angle from radians to degrees
    slope_angle_degrees = math.degrees(slope_angle_radians)

    # Return the slope, slope angle in degrees, and the intercept of the linear regression line
    return slope, slope_angle_degrees, intercept
Plot market data and linear regression line of best fit using Matplotlib
It’s not necessary, but it’s always a good idea to quickly plot our regression line to see if it makes sense for the data. To do this, we’ll use the very powerful charting library, Matplotlib. We’ll need the list of closing values as well as the outputs of the linear regression slope function we defined above.
import matplotlib.pyplot as plt

# Get regression values from our function
reg_slope, slope_angle, intercept = linear_regression_slope(closing_prices)

# Define x and y as numpy arrays
x = np.arange(len(closing_prices))
y = np.array(closing_prices)

# Define the size of our graph
plt.figure(figsize=(12, 8))

# Plot two separate lines: linear slope and closing prices
plt.plot(x, y, label='Market Data', marker='o', color='#2ECC71')
plt.plot(x, slope * x + intercept, label=f'Line of Best Fit (Slope Angle to x-axis: {slope_angle:.2f}°)', linestyle='--', color='#34495E')

# Add x- and y-axis labels
plt.xlabel(f"Days (from {(datetime.today() - timedelta(days=45)).strftime('%m/%d/%Y')})")
plt.ylabel('Closing Prices')

# Give the graph a title
plt.title('SPY Market Data with Linear Regression Line')

# Tell the graph to print the legend
plt.legend()

# Set the x-axis ticks to the day count from our start date
plt.xticks(x)

# Show us the graph!
plt.show()
After executing this code, we’re presented with the following chart. The line of best fit seems to represent the time series data points reasonably well, which gives us confidence. The reported slope angle is 39.26°, an apparent uptrend.
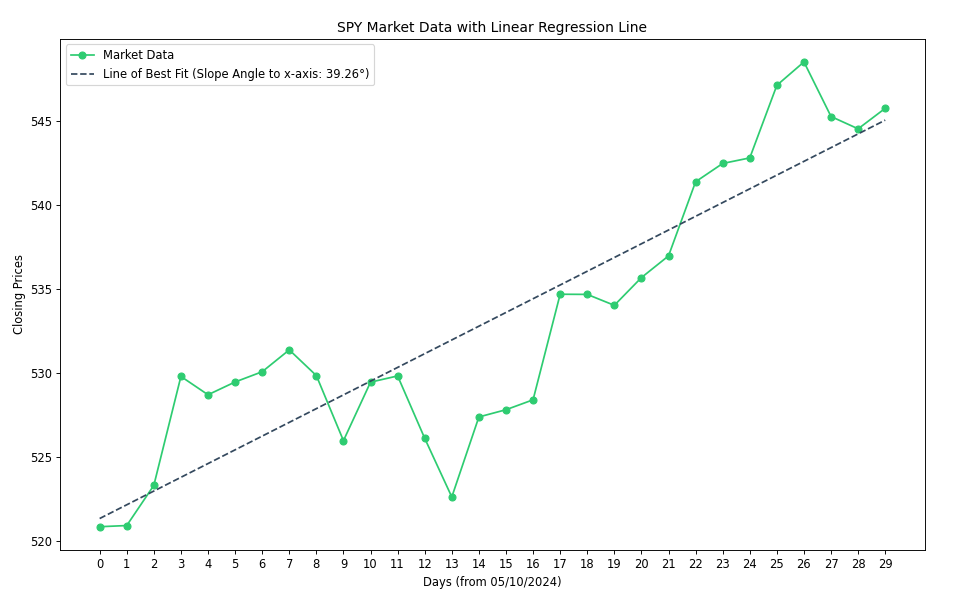
Now that we have a working indicator, we need a trading strategy. It seems reasonable to assume that a sufficient upward or downward slope angle over 30 trading days would indicate a trend. Figure 2 shows a clear uptrend at 39.26°, so perhaps above 30° or below -30° is a good barometer for long/short bias.
Executing a webhook automation inside of an Option Alpha bot
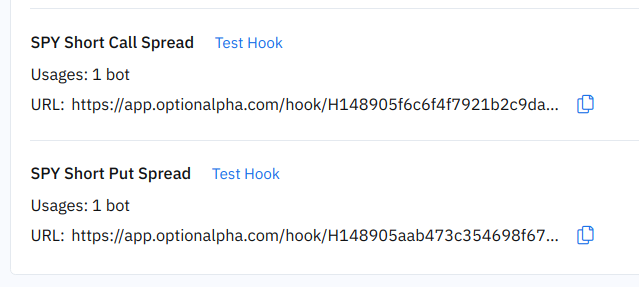
First, let’s create 2 new webhooks in Option Alpha by navigating to Settings. We’ll label them for SPY Short Put Spread and SPY Short Call Spread. I’m choosing to open a short put spread position to get long the underlying and a short call spread position to get short the underlying.
My intent for this strategy is to open one new position per week, so all I have to do is check for whether or not the bot has already opened a position this week. If not, we’re okay to proceed with our open position action.
With that in mind, next we have to establish the automations inside of a bot that are targets for our webhooks. The automations can be very simple because the Python script is doing the heavy lifting.
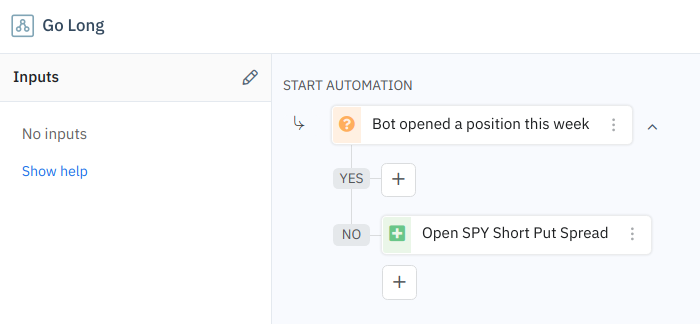
All that’s left to do is create two new automations inside our bot to be triggered by the individual webhook URLs. I’ll call them Go Long and Go Short for simplicity.
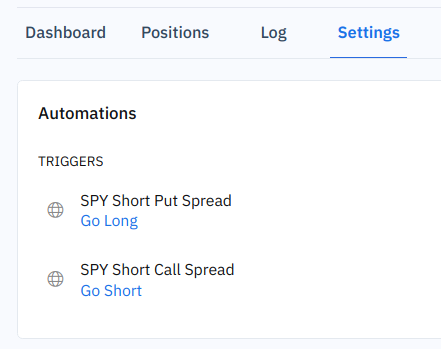
Our setup inside Option Alpha is ready and it’s finally time to run our strategy. The code and logic to execute is extremely simple since Option Alpha takes care of all the communication with the brokerage for trading. All we have to do is gather the market data, evaluate the slope angle, and make an HTTP request to our pre-defined webhooks.
API_KEY = 'my-secret-key';
symbol = 'SPY'

# Retrieve the market data closing prices
closing_prices = get_market_data(API_KEY, symbol)

# Execute our indicator save return values
reg_slope, slope_angle, intercept = linear_regression_slope(closing_prices)

# Print all of the data we calculated out to the console
print(f'Symbol: {symbol}\nSlope: {reg_slope:.2f}\nSlope Angle: {slope_angle:.2f}\nIntercept: {intercept:.2f}')

# Make an HTTP GET request to either the Go Long or Go Short webhooks
if slope_angle > 30:
    requests.get('https://app.optionalpha.com/hook/go-long...')
elif slope_angle < -30:
    requests.get('https://app.optionalpha.com/hook/go-short...')
Congratulations, you are now officially an algo trader!
All the Python code in one place
Here is all of the code we just discussed in 90 lines or less, packaged up in a concise script that you can copy/paste into your favorite IDE or editor. All commentary has been removed for brevity and several functions have been added for ease of use (e.g., plotting the data can easily be commented out). Enjoy!
import requests
import math
import sys

import numpy as np
import matplotlib.pyplot as plt

from scipy.stats import linregress
from datetime import datetime, timedelta


API_KEY = 'my-secret-key'


def linear_regression_slope(values):
    if len(values) < 2:
        raise ValueError("At least two values are required to calculate the slope.")

    x = np.arange(len(values))
    y = np.array(values)

    slope, intercept, r_value, p_value, std_err = linregress(x, y)

    slope_angle_radians = math.atan(slope)
    slope_angle_degrees = math.degrees(slope_angle_radians)

    return slope, slope_angle_degrees, intercept


def get_market_data(api_key, symbol):
    headers = {
        'Authorization': f'Bearer {api_key}',
        'Accept': 'application/json'
    }

    end_date = datetime.today().strftime('%Y-%m-%d')
    start_date = (datetime.today() - timedelta(days=45)).strftime('%Y-%m-%d')

    params = {
        'symbol': symbol,
        'interval': 'daily',
        'start': start_date,
        'end': end_date,
        'session_filter': 'all'
    }

    history = requests.get('https://api.tradier.com/v1/markets/history', params=params, headers=headers)

    bars = history.json().get('history', {}).get('day', [])
    closing_prices = [day.get('close') for day in bars if day.get('close')]

    return closing_prices


def plot_data(values, slope, intercept, slope_angle):
    x = np.arange(len(values))
    y = np.array(values)

    plt.figure(figsize=(12, 8))
    plt.plot(x, y, label='Market Data', marker='o', color='#2ECC71')
    plt.plot(x, slope * x + intercept, label=f'Line of Best Fit (Slope Angle to x-axis: {slope_angle:.2f}°)', linestyle='--', color='#34495E')
    plt.xlabel(f"Days (from {(datetime.today() - timedelta(days=45)).strftime('%m/%d/%Y')})")
    plt.ylabel('Closing Prices')
    plt.title('SPY Market Data with Linear Regression Line')
    plt.legend()
    plt.xticks(x)
    plt.show()


def run():
    symbol = 'SPY'
    closing_prices = get_market_data(API_KEY, symbol)

    if not len(closing_prices):
        print('Something went wrong retrieving data')
        sys.exit(1)

    reg_slope, slope_angle, intercept = linear_regression_slope(closing_prices)

    print(f'Symbol: {symbol}\nSlope: {reg_slope:.2f}\nSlope Angle: {slope_angle:.2f}\nIntercept: {intercept:.2f}')

    # Uncomment to see the chart
    # plot_data(closing_prices, reg_slope, intercept, slope_angle)

    if slope_angle > 30:
        requests.get('https://app.optionalpha.com/hook/go-long...')
    elif slope_angle < -30:
        requests.get('https://app.optionalpha.com/hook/go-short...'')


if __name__ == "__main__":
    run()
Wrapping Up
Today we explored how to enhance Option Alpha's bot automations using inbound webhooks and custom Python scripts. By leveraging data from Tradier’s Market API, we retrieved the last month’s closing values for SPY and calculated a custom Linear Regression Slope indicator. This indicator helps determine market trends and triggers an automation to either go long or short a position in SPY through webhooks.
Our approach combines Python for scripting and data processing, showcasing the platform's extensibility.
We detailed the mathematical concepts of linear regression slope and slope angle, which model relationships between variables and indicate trends. Using Python libraries like requests, SciPy, and Matplotlib, we retrieved market data, calculated the slope, plotted the data, and executed webhook automations based on the slope angle.
Stay tuned for more ideas on how to leverage the power of webhooks.
—
Disclaimer: All code provided in this article is for demonstration purposes only and is unsupported by Option Alpha. These indicators are free tools provided as examples of how to use webhooks in the Option Alpha platform. Option Alpha does not recommend, suggest, or advise any particular trading strategy or indicator. Past performance is never indicative of future results.

.png)
.png)


