Gamma exposure (GEX) measures the total gamma from all option positions across strike prices, providing insight into how market makers may hedge their portfolios as prices move. Because market makers aim to maintain a delta-neutral portfolio, shifts in gamma exposure can force them to buy or sell the underlying asset as the market changes.
Platforms like Option Alpha visualize gamma exposure across the options chain, allowing traders to analyze call vs put gamma, net gamma exposure, open interest, and intraday volume in one place. By combining these metrics, traders can better understand options positioning and how it may influence market behavior.
What is gamm exposure (GEX)?
Gamma is an option greek that measures the rate at which the delta for an option contract will change based on +/- $1 change in the underlying price. Since market makers seek to maintain a delta neutral portfolio (delta = 0), gamma "exposure" gives insight into specific strikes where there is a high amount of gamma that could cause market makers to re-hedge to maintain a delta neutral portfolio. This insight can help traders make timely trades in anticipation of predictable price action.
The charts in Option Alpha calculate gamma exposure (GEX) based on a +/- 1% move in the underlying price.
How Option Alpha calculates GEX
The charts in Option Alpha calculate gamma exposure based on a +/- 1% move in the underlying price.
Option Alpha GEX charts display:
- Call & Put gamma exposure
- Net GEX
- Absolute GEX
- Call & Put open interest
- Intraday volume
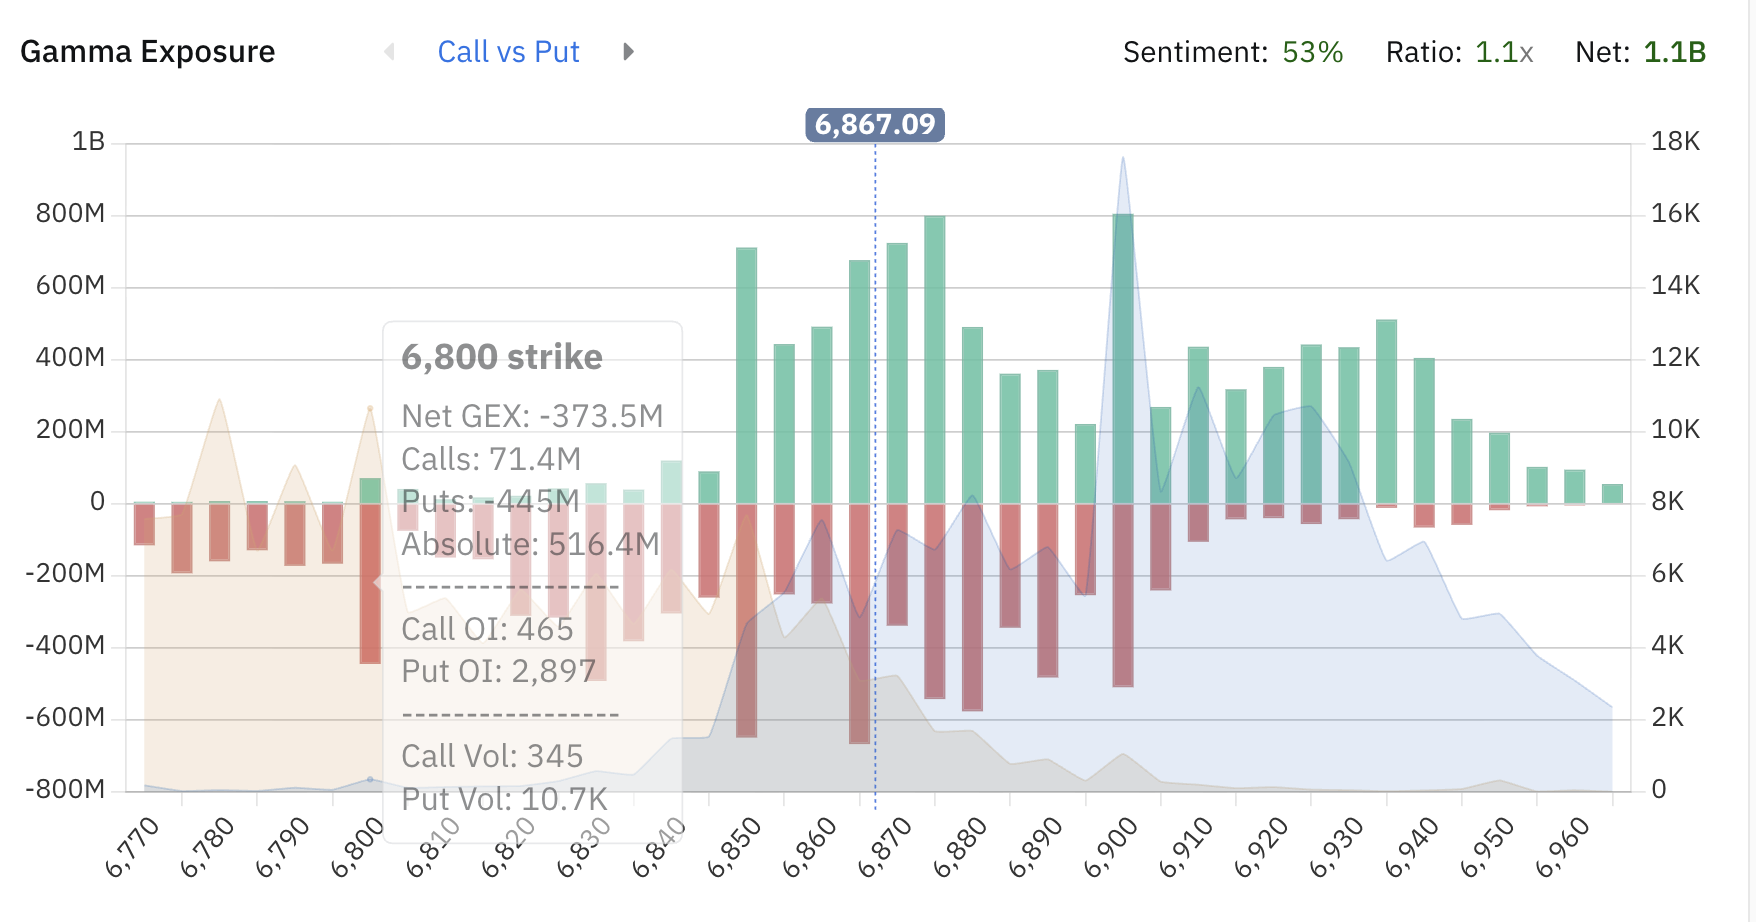
Call vs Put gamma exposure
The 'Call vs Put' view displays the direct call vs put GEX to highlight the amount of call strike and put strike gamma exposure, open interest, and volume for each strike price.
The green bars represent call GEX and the red bars put GEX.
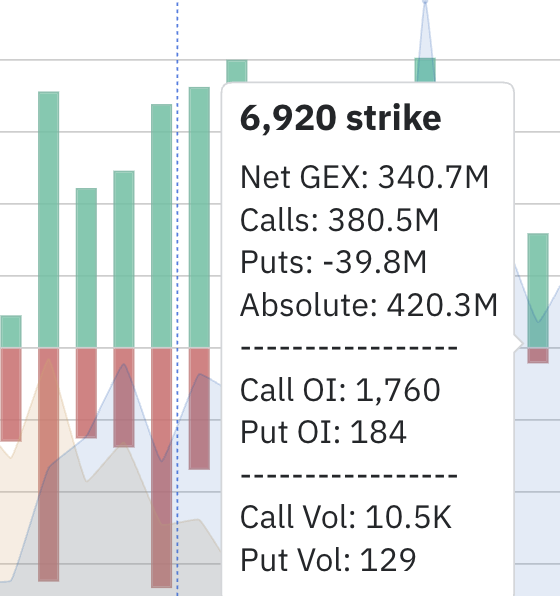
Absolute Gamma
Absolute Gamma is the total Gamma for a strike price calculated by summing the positive call gex and negative put gex into 1 positive gex value.
For example, if there is 380.5m call gamma exposure and -39.8m put gamma exposure, the absolute gamma is 420.3m.
Net Gamma Exposure
Net Gamma Exposure shows the combined total of positive call gex and negative put gex.
For example, if there is 9.6b call gamma exposure and -1b put gamma exposure, the net GEX is 8.6b.
Daily Volume
The background chart colors indicate intraday volume. Orange shading shows the total put volume for the day; the blue shading shows total call volume for the day. Grey is where they overlap.
GEX Ratio
The GEX ratio is the ratio of negative to positive gamma exposure. The ratio ‘flips; based on the current ratio. It only includes displayed bars, so it can be adjusted for only the strikes closest to the current price.
Example:
3b pos and 2b neg = 3b / 2b = 1.5x positive to negative GEX ratio (green)
3b neg and 2b pos = -3b / 2b = -1.5x negative to positive GEX ratio (red)
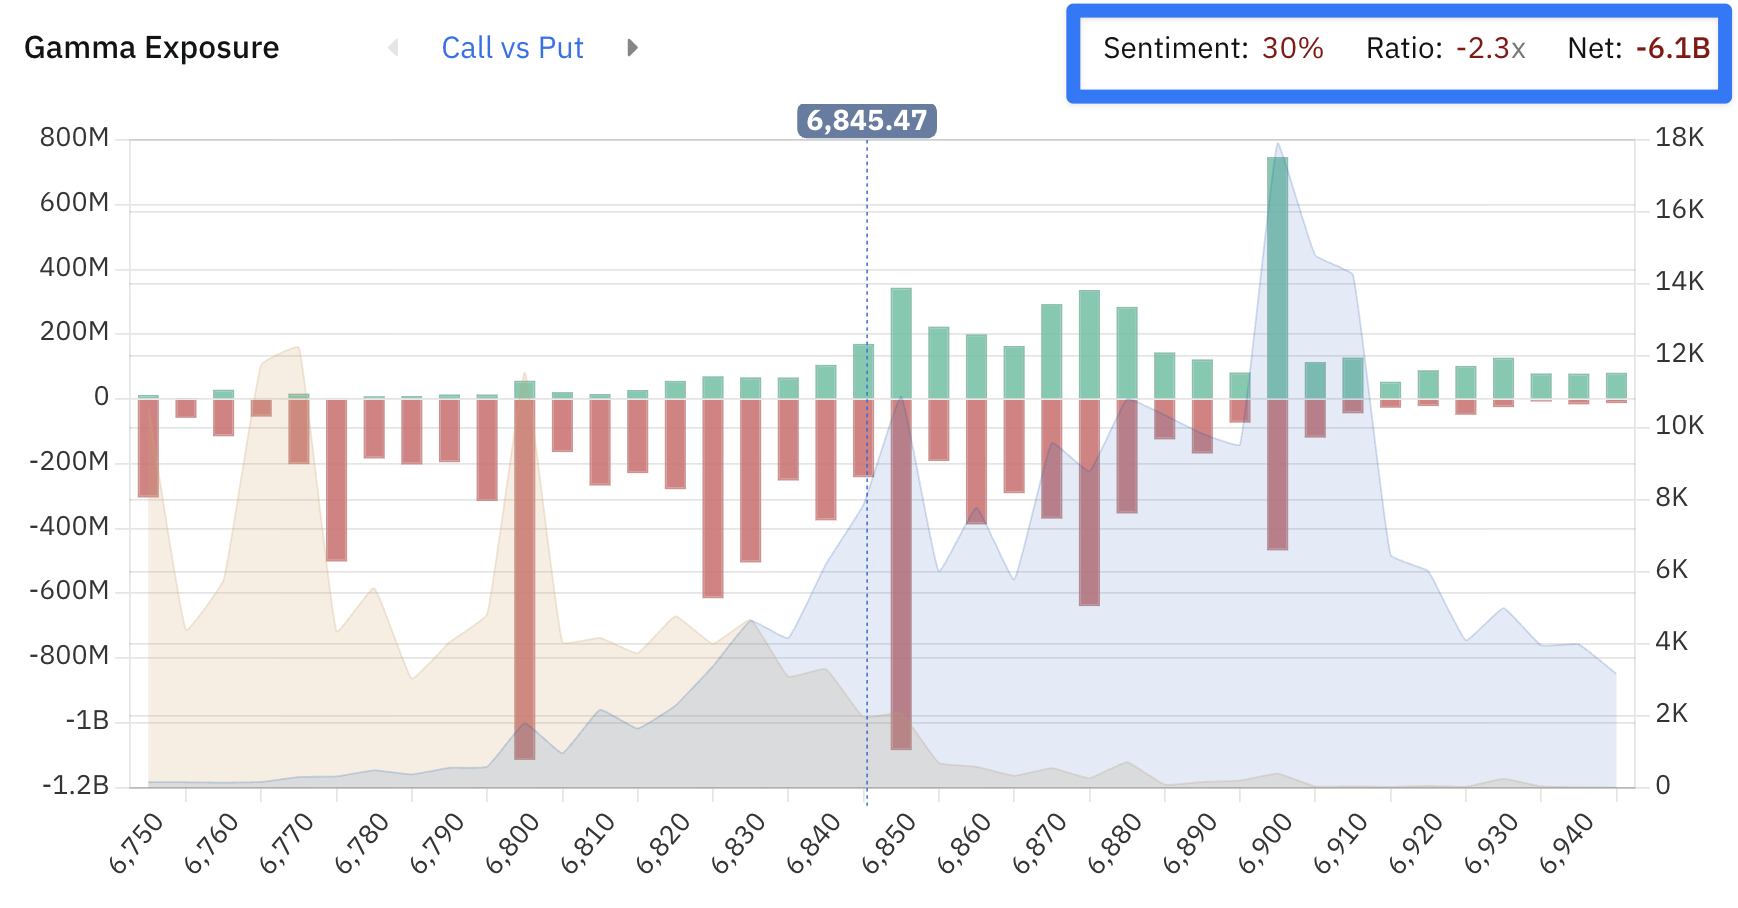
GEX Sentiment
GEX sentiment is the % of bars nearest to the current price that are positive.
In this chart, there is 2.3 times as much negative gamma as positive, and only 30% of the included bars are positive:
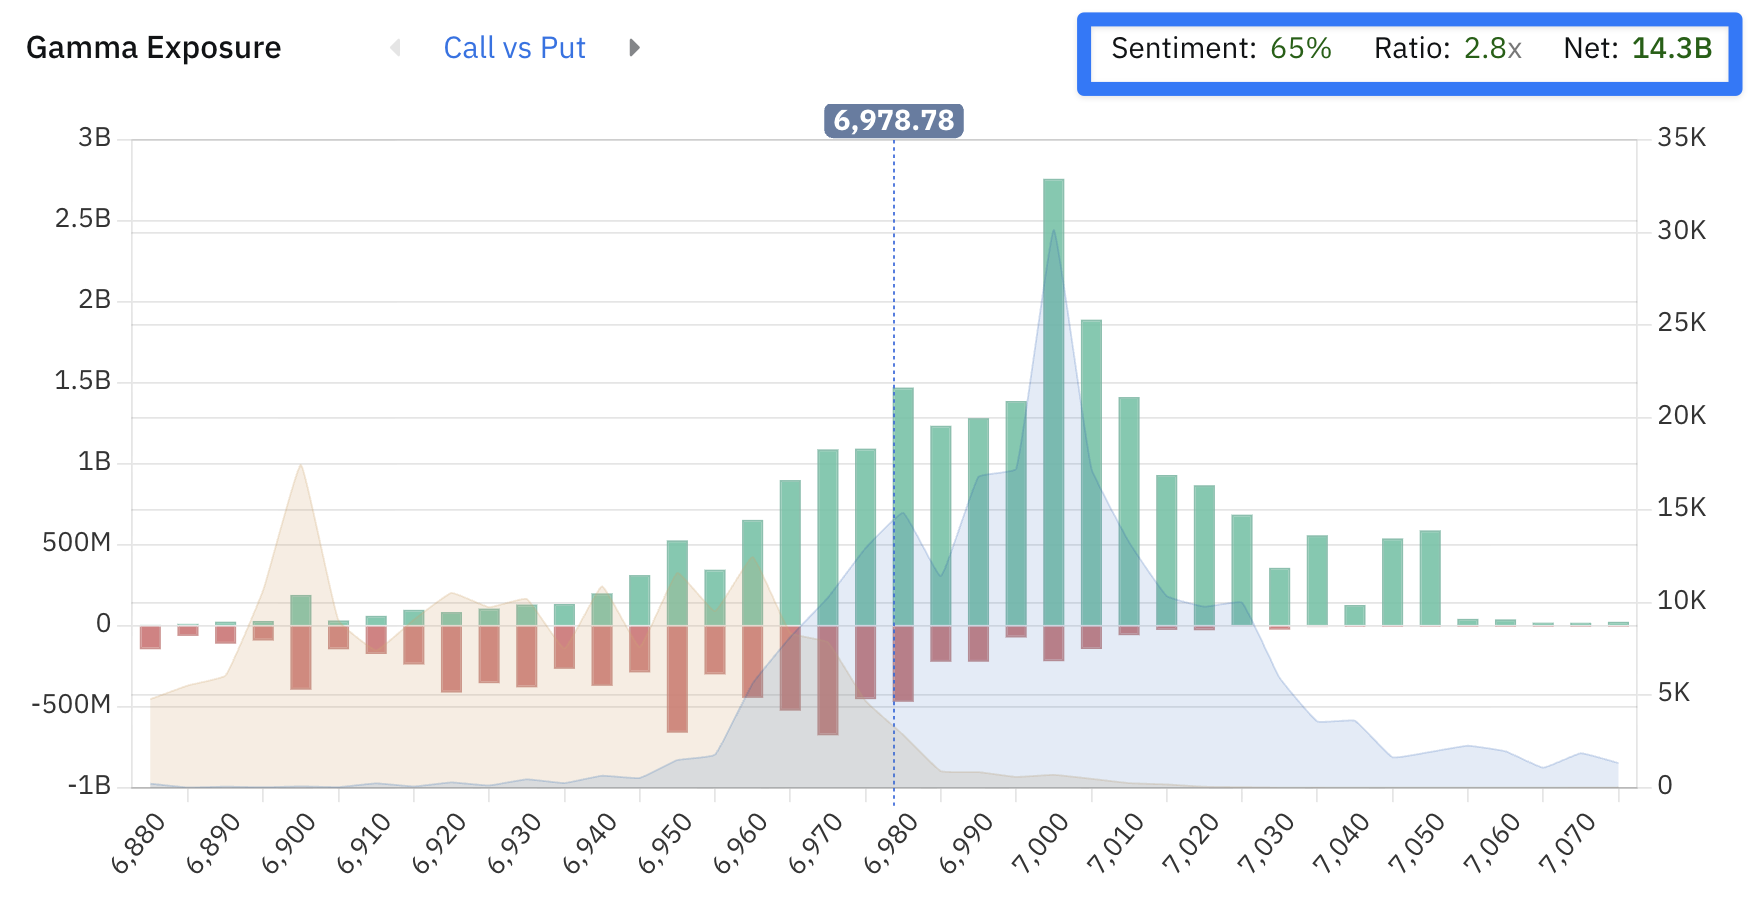
In this chart, there is 2.8x as much positive gamma as negative, and 65% of 40 the 40 strikes nearest the money are positive with a net total gamma of 14.3b:


'%3e%3cg id='Final-Copy-2_2_' transform='translate(1275.000000, 200.000000)'%3e%3cpath class='st0' d='M7.4,12.8h6.8l3.1-11.6H7.4C4.2,1.2,1.6,3.8,1.6,7S4.2,12.8,7.4,12.8z'/%3e%3c/g%3e%3c/g%3e%3c/g%3e%3cg id='final---dec.11-2020'%3e%3cg id='_x30_208-our-toggle' transform='translate(-1275.000000, -200.000000)'%3e%3cg id='Final-Copy-2' transform='translate(1275.000000, 200.000000)'%3e%3cpath class='st1' d='M22.6,0H7.4c-3.9,0-7,3.1-7,7s3.1,7,7,7h15.2c3.9,0,7-3.1,7-7S26.4,0,22.6,0z M1.6,7c0-3.2,2.6-5.8,5.8-5.8 h9.9l-3.1,11.6H7.4C4.2,12.8,1.6,10.2,1.6,7z'/%3e%3cpath id='x' class='st2' d='M24.6,4c0.2,0.2,0.2,0.6,0,0.8l0,0L22.5,7l2.2,2.2c0.2,0.2,0.2,0.6,0,0.8c-0.2,0.2-0.6,0.2-0.8,0 l0,0l-2.2-2.2L19.5,10c-0.2,0.2-0.6,0.2-0.8,0c-0.2-0.2-0.2-0.6,0-0.8l0,0L20.8,7l-2.2-2.2c-0.2-0.2-0.2-0.6,0-0.8 c0.2-0.2,0.6-0.2,0.8,0l0,0l2.2,2.2L23.8,4C24,3.8,24.4,3.8,24.6,4z'/%3e%3cpath id='y' class='st3' d='M12.7,4.1c0.2,0.2,0.3,0.6,0.1,0.8l0,0L8.6,9.8C8.5,9.9,8.4,10,8.3,10c-0.2,0.1-0.5,0.1-0.7-0.1l0,0 L5.4,7.7c-0.2-0.2-0.2-0.6,0-0.8c0.2-0.2,0.6-0.2,0.8,0l0,0L8,8.6l3.8-4.5C12,3.9,12.4,3.9,12.7,4.1z'/%3e%3c/g%3e%3c/g%3e%3c/g%3e%3c/g%3e%3c/svg%3e) Your Privacy Choices
Your Privacy Choices