
Start Here
Platform

Tour
Bots 101How it worksLive demo
Tools
Automated tradingOptions backtestingWatchlist scannerPrivate community
Use cases
New investorsStock tradersActive tradersPassive investorsSwing tradersAlgorithmic traders

Templates
By trade type
Stock trading botsOptions trading bots
By strategy type
Bullish options strategiesNeutral options strategiesBearish options strategiesHedging strategies
By style
Active and high frequency botsEvent-based botsTrend trading botsMomentum trading botsStatistic and probability-based botsTechnical analysis botsEarnings strategy bots

Integrations

Pricing
Education

Courses
Overview
By experience
Beginner
What is an options contract?Stock trading vs. options tradingOptions contract specificsCall vs. put options basicsBuying options vs. selling optionsOptions profit and loss diagramsOptions pricing tablesOption moneyness (ITM, OTM, and ATM)Options pricing and the "Greeks"Options expiration and assignmentWhat's our "edge" trading options?Single vs. multi-leg options strategiesSmall account options strategies
Intermediate
Fearless, confident options tradingHistorical volatility vs. implied volatilityPredicting market movesTrade size and capital reservesPortfolio balance and beta weightingHow to choose the best options strategyHow far out to place trades?Strike price anchoring with probabilitiesTips on getting your trades filledAdvanced and contingent orders7 step options trade entry checklist
Advanced
Developing a daily trading routineHow to avoid "Black Swan" eventsAdjusting and hedging option tradesExiting options trades automaticallyOptions strategies we don't adjust (and why)Big picture adjustment strategyWhen to adjust or notAdjusting straddles and stranglesAdjusting credit spreads, iron condors, and calendarsSmarter stop-loss ordersBuilding a diversified options portfolioRolling options trades for duration and premiumOptions expiration week position checklistDealing with stock assignment and dividendsHow to free up trading margin and cash
By subject
Options basics
Why options vs. stocks?What is an options contract?Smart use of leverageOption strike priceOption premiumOption expirationOption contract multiplierProfit and loss diagramsLong call option explainedShort call option explainedLong put option explainedShort put option explainedATM, ITM, and OTM optionsCash vs. margin basicsHigh probability trading definedHow to buy a call optionHow to buy a put optionSingle-leg vs. multi-legWhat is the VIX?Is fundamental analysis dead?
Entering and exiting trades
Game of numbers7 step entry checklistStrong liquidity examplesPicking the next directionScanning for tradesOption pricing table basicsSetting up your trade tabPinning your probability of profitUsing delta for probabilitiesBuy to open vs sell to openBuy to close vs sell to closeMarket, limit, stop loss orders5 types of contingent ordersLimit ordersMarket ordersLimit on close ordersMarket on close ordersAdvanced contingent ordersTaking profits before expirationMechanics of rollingConsider future events
Options expiration
Options expiration explainedWhat is the Options Clearing Corporation (OCC)?Physical vs. cash settlement optionsAmerican vs. European style optionsWeekly options expirationWeekly expiration tags/codesOptions assignment processOptions exercise processTrading timeline (duration)
Bullish options strategies
Bull put spreadBull call spreadLong callShort putBull call backspreadPut broken wing butterflyCall calendar spreadPut diagonal spreadCustom naked putCovered callSynthetic long stock
Neutral options strategies
Short straddleLong straddleIron condorsShort strangleLong strangleIron butterflyUnbalanced iron condors
Bearish options strategies
Bear call spreadBear put spreadLong putShort callBear put backspreadCall broken wing butterflyPut calendar spreadCall diagonal spreadCustom naked callCovered putSynthetic short stock
Portfolio managmeent
No guaranteed tradesDon't do something, sit thereAccount size adjustmentsAvoiding stock market overloadStocks, indexes, & ETFsMonitoring positionsCreating automatic alertsIndividual stock betaPortfolio betaBeta weighting your portfolioUncorrelated industries/sectorsSystematic vs. unsystematic riskEfficient portfolio frontierLimiting undefined risk tradesEconomic calendarConcept of legging
Options pricing and volatility
How to find option price quotesUnderstanding the mathIV vs. IV percentileProbability of profit vs. probability of touchOption probability curveBid-ask spread definedIV expected vs. actual moveThe "Greeks"Fatal pricing errorsInverse ETFsOptions parity
Adjusting trades
#1 adjustment for any tradeWhen to adjust a tradeSingle options trade vs. overall portfolioLeveraging the analyze tabCall spread adjustmentsPut spread adjustmentsShort strangle adjustmentsIron condor adjustmentsShort straddle adjustmentsCalendar spread adjustmentsDebit spread adjustmentsButterfly adjustmentsUsing stop lossesDelta hedgingRolling positionsPairs hedging

Strategies
Long callLong putShort callShort putCovered callCovered putProtective putCollar strategyLEAPSBull call debit spreadBear call credit spreadBull put credit spreadBear put debit spreadLong straddleShort straddleLong strangleShort strangleCall calendar spreadPut calendar spreadIron condorReverse iron condorIron butterflyReverse iron butterflyCall butterflyPut butterflyStrapCall diagonal spreadPut diagonal spreadCall ratio spreadPut ratio spreadCall backspreadPut backspreadLong box spreadShort box spreadReversalStock repair

Topics
OverviewAsset allocationAutomated tradingBehavioral financeBrokersCandlestick patternsChart patternsDividendsEconomic indicatorsEquity investmentsExercise & assignmentFinancial analysisFinancial historyFinancial marketsFinancial modelingFinancial theoriesFundamental analysisFuturesInvestment accountsInvestment taxesInvestor biasesMarket holidaysMarket hoursMarket indexesMarket indicatorsMomentum tradingOptionsOptions pricingOptions settlementPortfolio managementRisk managementStocksStock marketTechnical analysisTechnical indicatorsTrading commissionsTrading platformsTrading psychologyTrend trading
Resources

Workshops

Podcast

Blog
Support

Help Center
Overview
Getting started
What is a bot?Creating a botAutomation typesAutomation editorBot dashboardBot positionsBot logTemplates and cloningKey conceptsSafeguards and limitsPower of botsBest practices
Bot automations
What is an automation?Scanner automationsMonitor automationsEvent automationsEditing automationsReusing automationsCopying automationsOrdering automationsUsing custom inputsBot level inputsAutomation statusesAutomations library
Bot actions
DecisionsOpen positionClose positionNotificationsLoop symbolsLoop positionsBot tagsPosition tags
Bot examples
Genesis 1.0 botGenesis 2.0 botGenesis 3.0 botTrend trading with stocks botPortfolio trend trading botTrend trading with options botMultiple moving averages botTechnical swing trading botTrend and momentum botWeekly credit spread botRecurring iron condors botThe "Honey Badger" botHybrid spreads botHigh IV rank iron condor bot
Decision recipes
Comparing underlying symbol priceEvaluating symbol typeComparing underlying symbol propertiesEvaluating underlying symbol performanceEvaluating underlying symbol standard deviationComparing underlying symbol price to an indicatorComparing multiple underlying symbol indicatorsEvaluating underlying symbol implied volatility rankEvaluating underlying symbol earnings reportingEvaluating underlying symbol price probabilityEvaluating underlying symbol probability within rangeEvaluating bot propertiesEvaluating bot available capital for opportunitiesComparing bot position count to position typeComparing bot position count to underlying symbolEvaluating bot position count to position type and underlying symbolEvaluating bot last position activityEvaluating bot last activity with underlying symbolComparing bot active orders statusComparing bot active orders status with underlying symbolEvaluating bot position availabilityEvaluating bot tagsEvaluating opportunity availabilityEvaluating opportunity return expectationsComparing opportunity attributesComparing opportunity leg attributesComparing opportunity bid-ask spreadEvaluating opportunity probabilitiesEvaluating position performanceComparing profit target to trailing valueComparing position time to expirationComparing position durationEvaluating position underlying symbolComparing position propertiesComparing position leg propertiesEvaluating position typeEvaluating position sideComparing underlying symbol price to position legEvaluating position tagsEvaluating underlying symbol indicator propertiesComparing multiple underlying symbol indicator propertiesEvaluating MACD technical indicatorComparing Bollinger Bands to symbol priceEvaluating stochastic technical indicatorComparing VIX propertiesEvaluating market time of the dayEvaluating days of the weekEvaluating bot switches
Position statement
Activity summaryPosition detailsTrade detailsOpened positionsClosed positionsCanceled positionsOverride positionsExpired positionsPosition historyManually open positionManually close positionImport position
Order pricing
SmartPricingFinal price settingsPosition summaryOrder detailsWorking ordersManual override
Bot templates
Creating new templatesUpdating existing templatesDeleting templatesSharing templatesUpdating shared templatesTemplate best practices
Cloning bots
Cloning existing botsCloning from templateCloning from shared template
Troubleshooting
Using bot logsTesting your botsNot enough capital warningDaily position limit warningTotal position limit warningPricing anomaly warningMissing or invalid input errorDaily symbol limit errorExcessive errors failsafeOverlapping strikes failsafePrice exceeds strike-difference errorOptions expiration protocolDuplicate orders errorOptions approval level errorBot event loopsStock splits and corporate actionsSupported browsersSupported countries
Community forum
Community guidelinesCrafting your introductionSending group messagesSending private messagesAttaching bot templatesReceiving bot templatesAttaching automationsReceiving automationsFollowing tradersPosting publiclyEditing posts and messagesSubscribed discussionsUsing bookmarks
Using backtester
Running a new backtestBacktesting results summaryModifying existing backtestsMy backtestsBacktesting research databaseTop backtestsBacktesting errors
Account settings
My profileTrading accountsConnecting to TDAmeritradeConnecting to TradeStationConnecting to TradierIncompatible accountsPassword managementSession timeoutTwo-step authentication
Technical docs
Infrastructure and securityAutomation structureAutomation behaviorData feedsOrder handlingTrade enforcementsBroker rejection errorsBot limitationsProfit and lossFair value pricingDecision propertiesDecision calculationsParameter selectionCalculating probabilityPlatform indicators

Contact
Send FeedbackReport IssueEmail Us
Option AlphaOption Alpha

LoginFree Trial
EducationRisk ManagementPosition Sizing

Position Sizing

Position sizing is the method for determining the number of shares or contracts purchased in a security.

The number of shares or contracts and the price of the security determines the amount of capital invested in holding the position. Position sizing can be quantified as a percentage of an investor’s account.

For example, if an investor purchases 100 shares of a $100 stock, their position size is $10,000. If the account size is $50,000, the position size is 20% of the portfolio’s capital.

Position sizing is an important factor in portfolio construction and risk management. Investors typically do not want to commit a large portion of their portfolio to one investment as it decreases the available capital for other purchases and limits opportunities for diversification.

Position allocation as a percentage of account

Equity Risk

The equity risked on an investment is different than position sizing. The equity risked is the amount of capital an investor is willing to risk on an investment, and will typically be less than the position size.

To determine the position size for an investment, an investor must decide the amount of equity they are willing to risk. Typically, equity risk is calculated as a percentage of the portfolio.

Equity risked per trade as a percentage of account

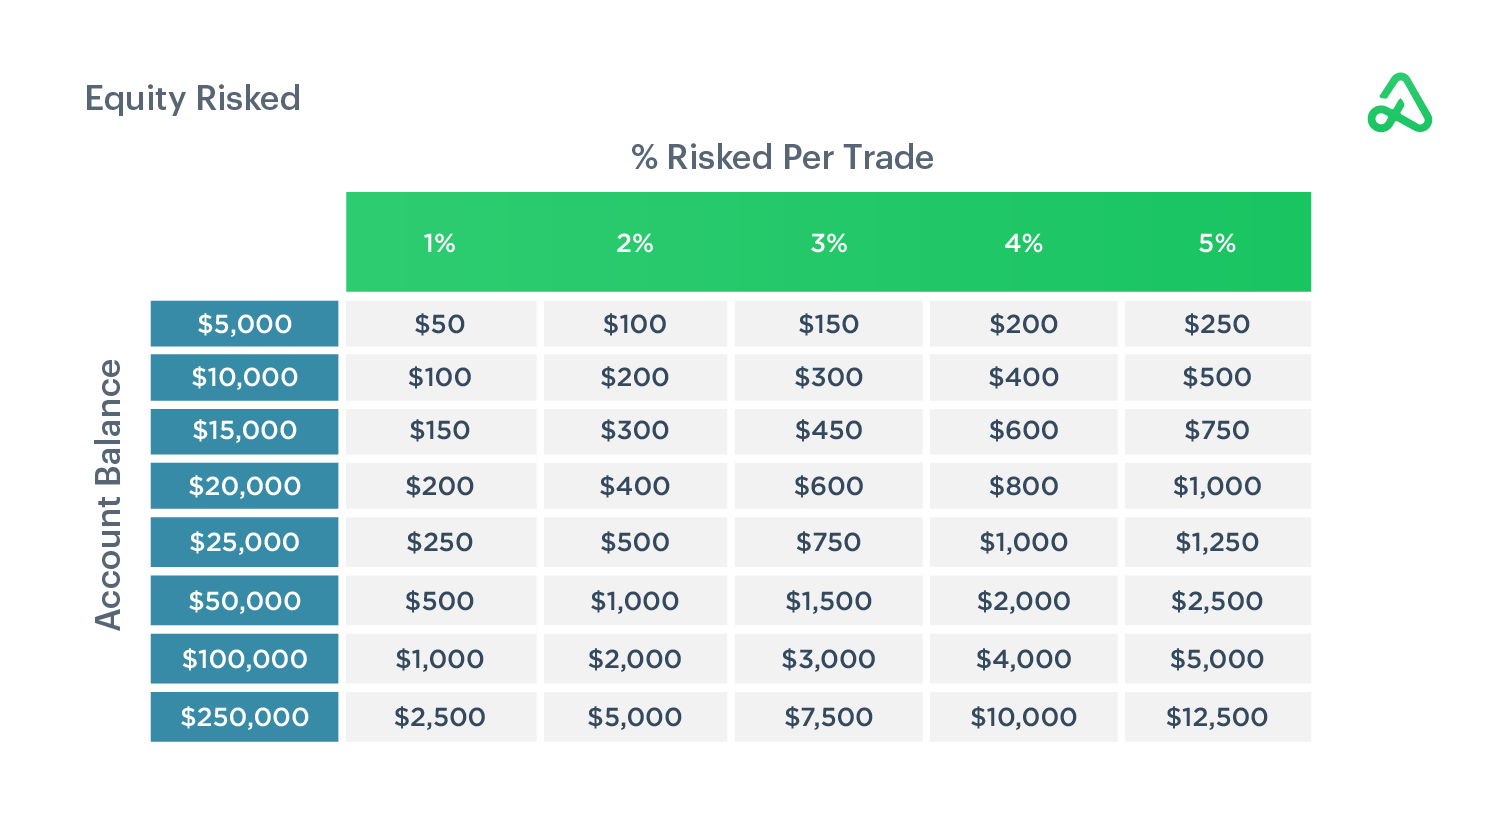
In the above example, the investor has an account size of $50,000. If they want to risk no more than 5% of their portfolio on a specific trade, the equity risked would be $2,500 per trade. 

Once the equity risked has been determined, the investor must decide how to allocate the available funds. In the above example, the investor has a $10,000 (20%) position size, and a maximum equity risked of $2,500 (5%). If 100 shares of a $100 stock have been purchased, the investor must set a stop-loss order at $75. If the stop-loss order is triggered, the net loss would be $2,500 ($100-$75 = $25 x 100 shares = $2,500). 

While the position size and equity risked may remain constant, the investor has many ways of creating different risk/reward opportunities.

For example, an investor could increase the position size to 25% and still only choose to have 5% equity risked. The stop would need to be placed at a closer distance to maintain 5% equity risk. In this scenario, the stop-loss would be $80 ($100-$80 = $20 x 125 shares = -$2,500).

When the investor knows how much equity they are willing to risk, they can build out their position size. It is important to note that setting a stop-loss does not guarantee a defined loss. Stocks can have large overnight gaps relative to their prior closing price, and may open well above or below the stop-loss order.

Sequence of Returns

Position sizing and equity risk are key components of risk management and are dictated by the investor. Sequencing of returns is an external factor that investors cannot control.

Position sizing helps calculate how many consecutive losses are needed to lose a defined percentage of an account. Sequencing of returns is the inherent risk that an investor could suffer multiple losses in a row.

Small position sizing helps mitigate the effects if an investor experiences a string of consecutive losses. The lower the equity risked per trade, the lower the probability that a sequence of poor trades will cause a significant drawdown that eliminates all of the trading capital in an account.

The following chart shows the likelihood of realizing consecutive losses given the probability of success for a strategy. As the likelihood of success increases, the probability of consecutive losses declines significantly.

Sequencing Returns image

For example, if a bull put credit spread is entered at the .30 delta, the position should have a roughly 70% probability of success. There is a 0.2% (1:412) chance of losing five consecutive trades with a 70% probability of success. This information can assist investors in determining proper capital allocation and position sizing when opening a position.

Join 200k+ options traders
Thank you! Please check your email!
Oops! Something went wrong...
Be the first to get notified when we publish new updates.

FAQs

What does a full position mean?

A full position means an investor has allocated the maximum amount of risk to a position, based on their individual trade plan.

For example, if an investor has a $100,000 account and does not want to risk more than 2% per trade, a full position would have $2,000 of risk.

Conversely, an investor is said to be “flat” when they have completely exited a position.

How do you determine the proper position size?

Position sizing is the method for determining the number of shares or contracts purchased in a security. The number of shares or contracts, the price of the security, and the volatility of the security determines the amount of capital invested to hold the position.

Position sizing is an important factor in portfolio construction and risk management. As the volatility of a security increases, investors often reduce the amount of capital allocated to the position. Investors typically do not want to commit a large portion of their portfolio to one investment as it decreases the available capital for other purchases and limits opportunities for diversification.

The proper position size will vary for each investor, depending on their account size, risk tolerance, and capital allocation goals. 

How do you find the equity risk premium? 

The equity risk premium is the excess return available through investing above a risk-free rate of return. The equity risk premium represents the additional profit to investors for bearing the risk of investing in the stock market relative to investing in assets such as Treasury bills. The amount of premium varies for different investments and is a function of the investment’s volatility.

How do you manage the sequence of return risk?

The sequence of returns is an external factor that investors cannot control. Sequencing of returns is the inherent risk that an investor could suffer multiple losses in a row.

Small position sizing helps mitigate the effects if an investor experiences a string of consecutive losses. Position sizing helps manage how many consecutive losses are needed to lose a defined percentage of an account.

The lower the equity risked per trade, the lower the probability that a sequence of poor trades will cause a significant drawdown that eliminates all of the trading capital in an account.

On this page
Equity Risk
Sequence of Returns
FAQs
Share this





No-code, fully automated trading for stocks and options.

HomeAboutLegalStatusContact
©2022 Option Alpha. All Rights Reserved. Patent Pending USSN 63/118,547