We want you to have all the information you care most about easily accessible on your bot’s homepage. So, you can now track your bot’s performance with two new metrics and visual charts.
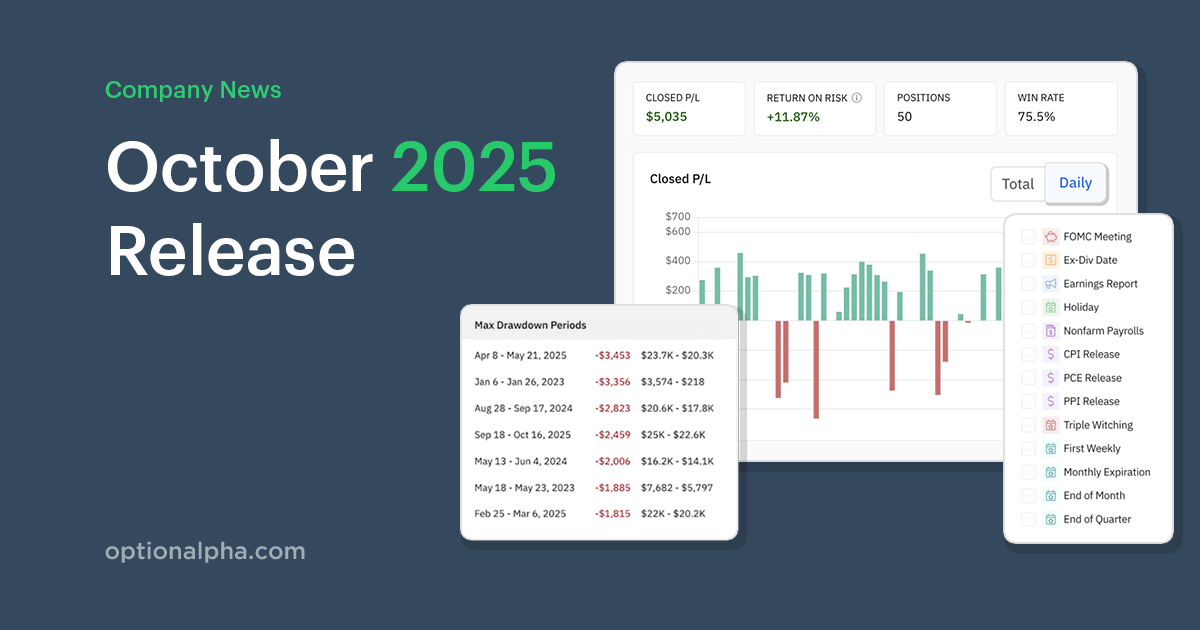
Every bot now includes the ability to view your closed P/L. Plus, we’ve also added win rate to the bot dashboard’s results.
Many of you have asked for a smoother equity curve that eliminates the erratic P/L movements outside of normal market hours. There’s now a simple drawdown selector on your bot’s dashboard that lets you view bot performance using Total P/L or Closed P/L only. This is a great way to see only your closed position’s returns and will give a more accurate representation of your bot’s results.
Since you all loved the capital at risk chart we added in the last release, we decided to include another valuable performance metric: the bot’s win rate. This will help you visualize your strategy’s expected outcome after enough trades allow the law of large numbers to set in, when win rates tend to consolidate near the expected outcome.

These enhancements will give you added clarity, and the upgraded visual tools provide detailed insight as you monitor your bots’ activity and key metrics.


.png)


