.png)
Payoff diagrams are officially on the platform!
But, these aren’t just any payoff diagrams. Option Alpha’s payoff diagrams are interactive and constantly update to reflect real-time changes in the market.
As traders, we understand that seeing payoff diagrams paints a picture of opportunity and risk. We also know that market changes are continuous, and your analytic capabilities should be, too. So, we made payoff diagrams that give you an in-depth snapshot for every new and existing position's real-time data. You can see your position’s projected profit and loss based on the underlying stock's price at that moment.
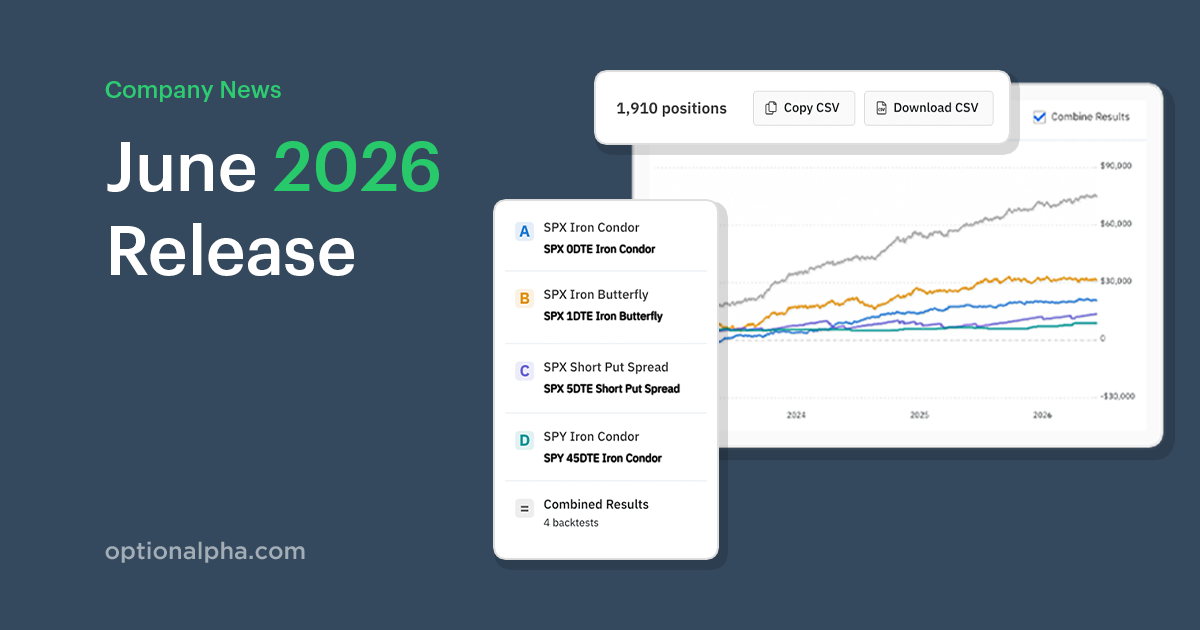
NEW UPDATE ALERT: Option Alpha's May 2024 Release includes a major update to position payoff diagrams! A new interactive payoff chart helps us visualize the payoff at expiration for current positions AND before opening a position.

The new options strategy payoff diagrams dynamically adjust throughout the trading day so you always have real-time information at your fingertips. That’s right. The diagrams re-calculate probabilities continuously based on current implied volatility, delta, underlying price, and more. You even get updated probability percentages right on the payoff diagram itself.
Every open position includes an interactive payoff diagram, complete with live stats and probabilities. So now you can quickly see each position’s return %, P/L, open and current price, risk, and four different option greeks. Plus, you can also quickly navigate to your position's ticker symbol page in the Watchlist to see current price action, technical indicators, and more.
We’ve spent a lot of time working on this visualization and there’s nothing else like it on any platform. We built the payoff diagram we knew traders wanted so you have all the details you need at a glance. They’re so much fun to play with, you might have a hard time pulling yourself away!


'%3e%3cg id='Final-Copy-2_2_' transform='translate(1275.000000, 200.000000)'%3e%3cpath class='st0' d='M7.4,12.8h6.8l3.1-11.6H7.4C4.2,1.2,1.6,3.8,1.6,7S4.2,12.8,7.4,12.8z'/%3e%3c/g%3e%3c/g%3e%3c/g%3e%3cg id='final---dec.11-2020'%3e%3cg id='_x30_208-our-toggle' transform='translate(-1275.000000, -200.000000)'%3e%3cg id='Final-Copy-2' transform='translate(1275.000000, 200.000000)'%3e%3cpath class='st1' d='M22.6,0H7.4c-3.9,0-7,3.1-7,7s3.1,7,7,7h15.2c3.9,0,7-3.1,7-7S26.4,0,22.6,0z M1.6,7c0-3.2,2.6-5.8,5.8-5.8 h9.9l-3.1,11.6H7.4C4.2,12.8,1.6,10.2,1.6,7z'/%3e%3cpath id='x' class='st2' d='M24.6,4c0.2,0.2,0.2,0.6,0,0.8l0,0L22.5,7l2.2,2.2c0.2,0.2,0.2,0.6,0,0.8c-0.2,0.2-0.6,0.2-0.8,0 l0,0l-2.2-2.2L19.5,10c-0.2,0.2-0.6,0.2-0.8,0c-0.2-0.2-0.2-0.6,0-0.8l0,0L20.8,7l-2.2-2.2c-0.2-0.2-0.2-0.6,0-0.8 c0.2-0.2,0.6-0.2,0.8,0l0,0l2.2,2.2L23.8,4C24,3.8,24.4,3.8,24.6,4z'/%3e%3cpath id='y' class='st3' d='M12.7,4.1c0.2,0.2,0.3,0.6,0.1,0.8l0,0L8.6,9.8C8.5,9.9,8.4,10,8.3,10c-0.2,0.1-0.5,0.1-0.7-0.1l0,0 L5.4,7.7c-0.2-0.2-0.2-0.6,0-0.8c0.2-0.2,0.6-0.2,0.8,0l0,0L8,8.6l3.8-4.5C12,3.9,12.4,3.9,12.7,4.1z'/%3e%3c/g%3e%3c/g%3e%3c/g%3e%3c/g%3e%3c/svg%3e) Your Privacy Choices
Your Privacy Choices