
Start Here
Platform

Tour
Bots 101How it worksLive demo
Tools
Automated tradingOptions backtestingWatchlist scannerPrivate community
Use cases
New investorsStock tradersActive tradersPassive investorsSwing tradersAlgorithmic traders

Templates
By trade type
Stock trading botsOptions trading bots
By strategy type
Bullish options strategiesNeutral options strategiesBearish options strategiesHedging strategies
By style
Active and high frequency botsEvent-based botsTrend trading botsMomentum trading botsStatistic and probability-based botsTechnical analysis botsEarnings strategy bots

Integrations

Pricing
Education

Courses
Overview
By experience
Beginner
What is an options contract?Stock trading vs. options tradingOptions contract specificsCall vs. put options basicsBuying options vs. selling optionsOptions profit and loss diagramsOptions pricing tablesOption moneyness (ITM, OTM, and ATM)Options pricing and the "Greeks"Options expiration and assignmentWhat's our "edge" trading options?Single vs. multi-leg options strategiesSmall account options strategies
Intermediate
Fearless, confident options tradingHistorical volatility vs. implied volatilityPredicting market movesTrade size and capital reservesPortfolio balance and beta weightingHow to choose the best options strategyHow far out to place trades?Strike price anchoring with probabilitiesTips on getting your trades filledAdvanced and contingent orders7 step options trade entry checklist
Advanced
Developing a daily trading routineHow to avoid "Black Swan" eventsAdjusting and hedging option tradesExiting options trades automaticallyOptions strategies we don't adjust (and why)Big picture adjustment strategyWhen to adjust or notAdjusting straddles and stranglesAdjusting credit spreads, iron condors, and calendarsSmarter stop-loss ordersBuilding a diversified options portfolioRolling options trades for duration and premiumOptions expiration week position checklistDealing with stock assignment and dividendsHow to free up trading margin and cash
By subject
Options basics
Why options vs. stocks?What is an options contract?Smart use of leverageOption strike priceOption premiumOption expirationOption contract multiplierProfit and loss diagramsLong call option explainedShort call option explainedLong put option explainedShort put option explainedATM, ITM, and OTM optionsCash vs. margin basicsHigh probability trading definedHow to buy a call optionHow to buy a put optionSingle-leg vs. multi-legWhat is the VIX?Is fundamental analysis dead?
Entering and exiting trades
Game of numbers7 step entry checklistStrong liquidity examplesPicking the next directionScanning for tradesOption pricing table basicsSetting up your trade tabPinning your probability of profitUsing delta for probabilitiesBuy to open vs sell to openBuy to close vs sell to closeMarket, limit, stop loss orders5 types of contingent ordersLimit ordersMarket ordersLimit on close ordersMarket on close ordersAdvanced contingent ordersTaking profits before expirationMechanics of rollingConsider future events
Options expiration
Options expiration explainedWhat is the Options Clearing Corporation (OCC)?Physical vs. cash settlement optionsAmerican vs. European style optionsWeekly options expirationWeekly expiration tags/codesOptions assignment processOptions exercise processTrading timeline (duration)
Bullish options strategies
Bull put spreadBull call spreadLong callShort putBull call backspreadPut broken wing butterflyCall calendar spreadPut diagonal spreadCustom naked putCovered callSynthetic long stock
Neutral options strategies
Short straddleLong straddleIron condorsShort strangleLong strangleIron butterflyUnbalanced iron condors
Bearish options strategies
Bear call spreadBear put spreadLong putShort callBear put backspreadCall broken wing butterflyPut calendar spreadCall diagonal spreadCustom naked callCovered putSynthetic short stock
Portfolio managmeent
No guaranteed tradesDon't do something, sit thereAccount size adjustmentsAvoiding stock market overloadStocks, indexes, & ETFsMonitoring positionsCreating automatic alertsIndividual stock betaPortfolio betaBeta weighting your portfolioUncorrelated industries/sectorsSystematic vs. unsystematic riskEfficient portfolio frontierLimiting undefined risk tradesEconomic calendarConcept of legging
Options pricing and volatility
How to find option price quotesUnderstanding the mathIV vs. IV percentileProbability of profit vs. probability of touchOption probability curveBid-ask spread definedIV expected vs. actual moveThe "Greeks"Fatal pricing errorsInverse ETFsOptions parity
Adjusting trades
#1 adjustment for any tradeWhen to adjust a tradeSingle options trade vs. overall portfolioLeveraging the analyze tabCall spread adjustmentsPut spread adjustmentsShort strangle adjustmentsIron condor adjustmentsShort straddle adjustmentsCalendar spread adjustmentsDebit spread adjustmentsButterfly adjustmentsUsing stop lossesDelta hedgingRolling positionsPairs hedging

Strategies
Long callLong putShort callShort putCovered callCovered putProtective putCollar strategyLEAPSBull call debit spreadBear call credit spreadBull put credit spreadBear put debit spreadLong straddleShort straddleLong strangleShort strangleCall calendar spreadPut calendar spreadIron condorReverse iron condorIron butterflyReverse iron butterflyCall butterflyPut butterflyStrapCall diagonal spreadPut diagonal spreadCall ratio spreadPut ratio spreadCall backspreadPut backspreadLong box spreadShort box spreadReversalStock repair

Topics
OverviewAsset allocationAutomated tradingBehavioral financeBrokersCandlestick patternsChart patternsDividendsEconomic indicatorsEquity investmentsExercise & assignmentFinancial analysisFinancial historyFinancial marketsFinancial modelingFinancial theoriesFundamental analysisFuturesInvestment accountsInvestment taxesInvestor biasesMarket holidaysMarket hoursMarket indexesMarket indicatorsMomentum tradingOptionsOptions pricingOptions settlementPortfolio managementRisk managementStocksStock marketTechnical analysisTechnical indicatorsTrading commissionsTrading platformsTrading psychologyTrend trading
Resources

Workshops

Podcast

Blog
Support

Help Center
Overview
Getting started
What is a bot?Creating a botAutomation typesAutomation editorBot dashboardBot positionsBot logTemplates and cloningKey conceptsSafeguards and limitsPower of botsBest practices
Bot automations
What is an automation?Scanner automationsMonitor automationsEvent automationsEditing automationsReusing automationsCopying automationsOrdering automationsUsing custom inputsBot level inputsAutomation statusesAutomations library
Bot actions
DecisionsOpen positionClose positionNotificationsLoop symbolsLoop positionsBot tagsPosition tags
Bot examples
Genesis 1.0 botGenesis 2.0 botGenesis 3.0 botTrend trading with stocks botPortfolio trend trading botTrend trading with options botMultiple moving averages botTechnical swing trading botTrend and momentum botWeekly credit spread botRecurring iron condors botThe "Honey Badger" botHybrid spreads botHigh IV rank iron condor bot
Decision recipes
Comparing underlying symbol priceEvaluating symbol typeComparing underlying symbol propertiesEvaluating underlying symbol performanceEvaluating underlying symbol standard deviationComparing underlying symbol price to an indicatorComparing multiple underlying symbol indicatorsEvaluating underlying symbol implied volatility rankEvaluating underlying symbol earnings reportingEvaluating underlying symbol price probabilityEvaluating underlying symbol probability within rangeEvaluating bot propertiesEvaluating bot available capital for opportunitiesComparing bot position count to position typeComparing bot position count to underlying symbolEvaluating bot position count to position type and underlying symbolEvaluating bot last position activityEvaluating bot last activity with underlying symbolComparing bot active orders statusComparing bot active orders status with underlying symbolEvaluating bot position availabilityEvaluating bot tagsEvaluating opportunity availabilityEvaluating opportunity return expectationsComparing opportunity attributesComparing opportunity leg attributesComparing opportunity bid-ask spreadEvaluating opportunity probabilitiesEvaluating position performanceComparing profit target to trailing valueComparing position time to expirationComparing position durationEvaluating position underlying symbolComparing position propertiesComparing position leg propertiesEvaluating position typeEvaluating position sideComparing underlying symbol price to position legEvaluating position tagsEvaluating underlying symbol indicator propertiesComparing multiple underlying symbol indicator propertiesEvaluating MACD technical indicatorComparing Bollinger Bands to symbol priceEvaluating stochastic technical indicatorComparing VIX propertiesEvaluating market time of the dayEvaluating days of the weekEvaluating bot switches
Position statement
Activity summaryPosition detailsTrade detailsOpened positionsClosed positionsCanceled positionsOverride positionsExpired positionsPosition historyManually open positionManually close positionImport position
Order pricing
SmartPricingFinal price settingsPosition summaryOrder detailsWorking ordersManual override
Bot templates
Creating new templatesUpdating existing templatesDeleting templatesSharing templatesUpdating shared templatesTemplate best practices
Cloning bots
Cloning existing botsCloning from templateCloning from shared template
Troubleshooting
Using bot logsTesting your botsNot enough capital warningDaily position limit warningTotal position limit warningPricing anomaly warningMissing or invalid input errorDaily symbol limit errorExcessive errors failsafeOverlapping strikes failsafePrice exceeds strike-difference errorOptions expiration protocolDuplicate orders errorOptions approval level errorBot event loopsStock splits and corporate actionsSupported browsersSupported countries
Community forum
Community guidelinesCrafting your introductionSending group messagesSending private messagesAttaching bot templatesReceiving bot templatesAttaching automationsReceiving automationsFollowing tradersPosting publiclyEditing posts and messagesSubscribed discussionsUsing bookmarks
Using backtester
Running a new backtestBacktesting results summaryModifying existing backtestsMy backtestsBacktesting research databaseTop backtestsBacktesting errors
Account settings
My profileTrading accountsConnecting to TDAmeritradeConnecting to TradeStationConnecting to TradierIncompatible accountsPassword managementSession timeoutTwo-step authentication
Technical docs
Infrastructure and securityAutomation structureAutomation behaviorData feedsOrder handlingTrade enforcementsBroker rejection errorsBot limitationsProfit and lossFair value pricingDecision propertiesDecision calculationsParameter selectionCalculating probabilityPlatform indicators

Contact
Send FeedbackReport IssueEmail Us
Option AlphaOption Alpha

LoginFree Trial
BlogResearch InsightsBid-Ask Spread Anomalies: Risk and Opportunity

Bid-Ask Spread Anomalies: Risk and Opportunity

Learn how bid-ask spread anomalies bring unique risks and opportunities in options trading with this SPY case study.
Bid-Ask Spread Anomalies: Risk and Opportunity
Ben Painter
Jul 14, 2021
•
8 min read





In previous Research Insights blogs, we defined the bid-ask spread, explored typical spread behavior, and walked through multiple case studies. If you haven’t read those posts, make sure to start there so you are up-to-date!

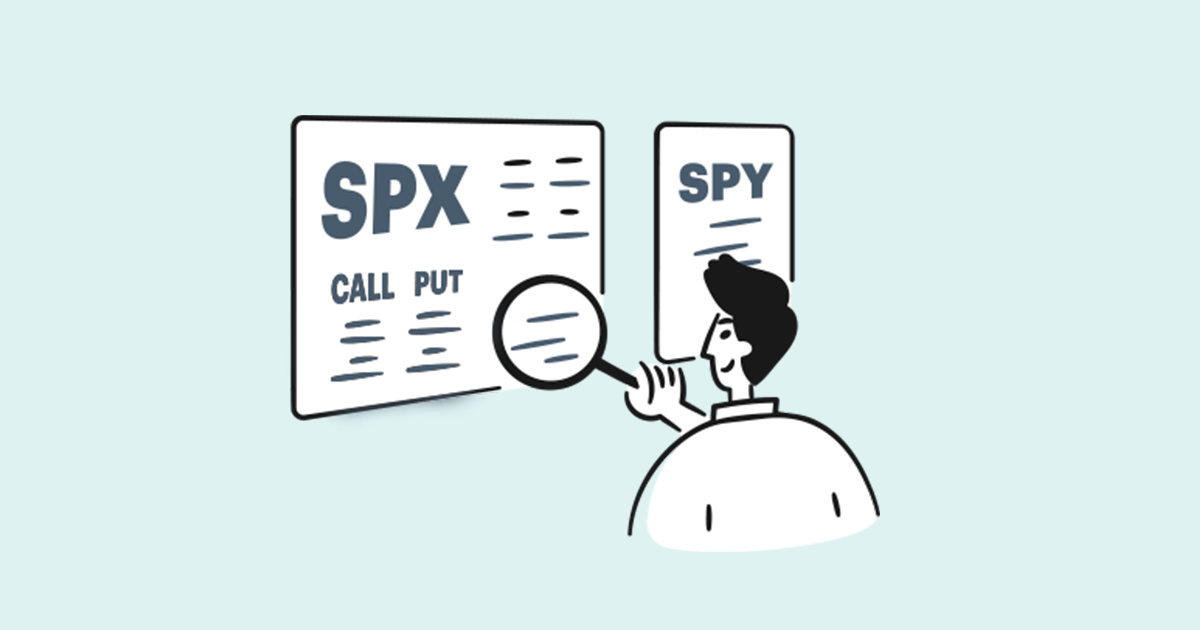
Today, we go a step further. Not only are bid-ask spreads unique across different underlyings, but the spreads you see on your screen for multi-leg positions are unique at the contract level.

Every contract has individual market forces influencing the bid and ask price you see, and those contract-specific factors have a meaningful impact on the pricing of your positions.

Does the depth of your research show awareness of the individual contract influences on the pricing of your positions? Would your answer be different for a non-trading life decision?

When purchasing a new vehicle, does your research stop at comparing manufacturers, or do you also explore vehicle types and models? Each vehicle type (e.g. SUV vs. Car) and each model have unique features relevant to your decision. Choosing Honda or any other manufacturer does not get you to the purchase decision finish line. Why should your trading be different? 

Every position has the potential for unique anomalies, often in the bid-ask spread, and properly understanding the potential for variability adds a necessary layer to your trading approach. In the last post, we laid a foundation, showing what bid-ask spreads should resemble.

Today, we’ll zero in on the role of market makers, identify some contract anomalies, and understand what this reality means for your trading.

Who Controls the Bid-Ask Spread?

If you’re new to financial markets, you likely don’t fully understand who or what creates the bid-ask spread and directly impacts it. Not to worry, let’s build on content from previous articles to clarify.

Bid-ask spreads are heavily influenced by market makers who act as a “go-between” for buyers and sellers of financial instruments, producing more efficient markets. Market makers stand ready to buy or sell securities at any time. They offer to buy securities at one price (bid) and to sell at another price (ask), forming a bid-ask spread.

The spread between the bid and ask price is the market makers’ compensation for providing liquidity and bearing risk. What would cause market makers to widen or narrow this spread?

If the bid-ask spread exists to compensate market makers for the risk of major moves in securities, then it is logical that the spread will widen when market volatility increases. Higher volatility produces a higher probability that the market maker will hold a position that moves against them. Because of that added risk, the spread widens.

The number of market participants also influences spreads. As more individuals enter a particular market, liquidity increases, and the bid-ask spread tends to tighten. During periods of low liquidity or high volatility, the bid-ask spread tends to widen. 

To intuitively understand the role of market participants and liquidity, think about the difference between purchasing a loaf of bread and a house. The level of price stability for each item is directly tied to the number of market participants. The house price is more variable and unpredictable simply because there are not as many buyers competing for the same item. A loaf of bread has countless potential buyers, all subconsciously creating efficient pricing through their purchase decisions. 

Back to financial markets, if there is a low trading volume in a particular market or contract, you can expect more volatile pricing and wider spreads simply because there are not as many interested parties, creating less efficient pricing. These facts about market makers and market participants paint the picture of how market pricing and bid-ask spread movements typically function. They are a key contributor to the asset personality mentioned in the previous blog post.

However, the typical is not always reality when you drill down to the contract level. Let’s look at a real-world example of contract-specific bid-ask spread anomalies.

SPY At-The-Money Case Study

What does the interchange of volatility, liquidity, market participants, and the bid-ask spread look like?

For this study, we collected tick-by-tick data for the September monthly expiration of SPY on Tuesday, 1 June 2021. The data collected ranges from 9:45 AM-3:45 PM EST, avoiding the typical bid-ask volatility present during price discovery at the open and close.

Unlike the TLT case study, we did not construct a sample trade. Instead, the goal was to analyze the data for pricing anomalies in near-the-money contracts. The trading range for SPY on June 1 is shown in Figure 1.

SPY sport price on June 1, 2021

Figure 2 below shows the bid and ask prices for a 415 SPY call with a September expiration. This contract was slightly out-of-the-money throughout the trading day and was selected for analysis because of its high trading volume due to its proximity to SPY’s spot price.

The focal point of this visualization is obvious. The outlying data point at 10 AM is a $3.16 bid-ask spread. With that magnitude, you’d expect the average spread on June 1 for this particular SPY contract to be skewed high. That would be incorrect; the average spread for the remainder of the day after 10 AM was only 6.0 cents, with the day’s overall average (including 10 AM) at 6.2 cents.

This high-magnitude event barely touches the average contract spread. Why? 

SPY 17 September 2021 call bid-ask price on June 1, 2021

Take a look at the top panel in Figure 3. This is the same 415 call as in Figure 2 but drilled down to the two-minute interval around 10 AM. The spread anomaly mentioned above lasts for only 10 seconds, or ~7 ticks, mainly driven by a drop in the bid price. For reference, the 415 call had 16,945 ticks during our defined collection window. This event was so short-lived that you would remain ignorant of the extreme volatility unless you explored individual tick data.

The story is similar for other calls surrounding SPY’s $419 closing price. The 425 and 420 call shown below, along with all strikes between them (not pictured), show jumpy bid-ask spreads at 10 AM. In-the-money, at-the-money, and out-of-the-money call contracts all show bid-ask spread volatility at 10 AM.

SPY 17 September 2021 call bid-ask spread range for 3 different contracts

Is there a similar story on the put side?

The trend in call-side contracts was not present on the put side. The put contract data shows a different, arguably more interesting, trend.

Figure 4 displays four slightly in-the-money puts that remained in-the-money throughout the trading day. These put contracts exhibit the same 10 AM anomaly, except for the 426 strike. Spreads generally widen, but not on the 426 put contract.

At a high level, a trader would see minimal differences in the average spread between the 426 and 427 puts (26 cents and 30 cents, respectively), but this tick-by-tick data shows otherwise.

Remember what we said earlier about individual market forces? Here’s your example. While the traditional explanations of market makers and underlying volume may have had some impact, they were clearly not the only factors present in this anomaly.

SPY 17 September 2021 put bid-ask spread range for 4 different contracts

Let’s continue with the car shopping analogy. These SPY contracts, calls and puts, are the same vehicle manufacturer (underlying), and some are even the same vehicle type (call vs. put), but they are not the same model (contract). There are unique, contractual market forces at play, causing phenomena like the widening in the 425 and 427 puts but not the 426 put. Sometimes contracts move together like on the call-side, but that correlation does not change the unique nature of each contract.

So, what’s causing this volatility? Is this a result of large, delayed institutional orders? Possibly. Is this a significant player balancing their books on the first of the month? Could be. Is this all based on differences in volume? Doubtful, but maybe.

Think back on our discussion of market makers and spread width; those forces do not adequately explain these anomalies. Spreads do widen based on volume and volatility, but those factors do not justify a less than 10-second, multi-dollar spread increase. If that is insufficient, remember that June 1 was also a relatively quiet trading day for SPY. The ETF traded in a $3.46 range, compared with an average true range of $4.20. 

Answering these questions requires much more than a single day’s picture. We’ve been digging through terabytes of tick-by-tick data collected so far, identifying and analyzing anomalies similar to those highlighted above.

All of this analysis is done to better equip you in developing a more complete trading system. A clearer picture of what is happening under the hood provides a deeper understanding of your trading strategies’ potential strengths and weaknesses.

Speaking of your strategies, let's talk about why leveraging this knowledge is impactful for you as a trader.

Key Takeaways

Whether you realize it or not, your strategies have rules behind them. Maybe you have a clearly defined list of entry and exit criteria, placing trades only within those bounds, or you might have basic mental guidelines that you tend to follow. In either case, your system has rules and trading criteria. 

Underpinning a trader’s rules are assumptions about how markets operate: you expect certain liquidity from specific securities, and perhaps you expect contract X to correlate with contract Y. Broadly, these assumptions often hold. But, as we saw in the case above, a zoomed-in view shows a trader the potential short-term volatility behind his or her assumptions.

Are you prepared for those extreme, rule-breaking events?

Is it likely that you will open or close a position at one of these extreme-spread prices? No, a prudent trader has rules and systems in place to prevent those anomalies from impacting the broader strategy. However, these market events are real, and this volatility produces threats and opportunities depending on your level of understanding. We want to provide you with actionable insights into the markets you trade, turning potential threats into tradable opportunities.

Our goal is to offer information that enhances your strategies and supports your trading success. Check back as we dive deeper into these anomalies and what they mean for your trading life!

Bid-Ask Spread
Portfolio Management
Research
You're on the list right?
Want to know when new posts go live? Subscribe to get updates each time we publish new training, research, or case studies. Autotrading is moving fast so don't get left behind.
‍
Thank you! Please click the verification link we just sent to your email address.
Oops! Something went wrong while submitting the form.
We’ll never share your email address
Featured posts
New Open High Low Close (OHLC) Stock Decisions
June 10, 2022
Create Bots Instantly from Any Backtest
June 11, 2022
Introducing the Bot Wizard
June 11, 2022
How to Automate a Bollinger Band Strategy
March 31, 2022
We Analyzed 20,000 Options Trades: Here’s What We Learned About Position Swings
March 25, 2022
Backtester Enhancements Unlock Research Superpowers for Options Traders
February 22, 2022
Building an RSI Swing Trading Bot with Credit Spreads
December 13, 2021
3 Smart Ways to Use SmartStops
December 8, 2021
5-Year SPY Put Credit Spread Backtest
November 17, 2021
Managing Multiple Strategy Types with Monitor Automations
June 30, 2021
Automated Does Not Mean Unattended
May 19, 2021
Using Bots to Automate Profit Targets and Stop Losses
April 19, 2021
Most popular
See All
13 Stock Chart Patterns that You Can’t Afford to Forget
6 min read
The Three Best Option Strategies for Earnings
8 min read
How Can a Call Option Decline in Value When a Stock Rises?
3 min read
What Your Mother Didn’t Tell You About Trading Iron Condors
4 min read
4 Must Know Options Expiration Day Traps to Avoid
5 min read
Problems Getting Your Option Order Filled? Try These 3 Quick Adjustments
7 min read
How to Set Up a Broken-Wing Butterfly Option Strategy
3 min read
5-Year SPY Put Credit Spread Backtest
7 min read
3 Option Strategies to Use During Low Volatility Markets
2 min read
Naked Option Selling: The Stupid Myth of "Unlimited Losses"
6 min read
Rising Interest Rates: Taper Tantrum or Opportunity?
5 min read
Mastering the 4 Different Types of Option Orders
8 min read

No-code, fully automated trading for stocks and options.

HomeAboutLegalStatusContact
©2022 Option Alpha. All Rights Reserved. Patent Pending USSN 63/118,547