An iron butterfly is a combination of a short straddle and iron condor. It's a great strategy to use during very high IV setups when you also want to reduce the capital required to hold the trade.
You'll build this strategy by selling both the ATM call and ATM put strike (similar to a straddle) and then buying further OTM wings for protection (like an iron condor).
How to enter an iron butterfly:
- Ticker symbol
- Expiration
- Strike prices
- Position sizing
- Reward/risk
- Exit options
For example, if SPY is trading near 755, and you think it will stay relatively close to that price before expiration, you could open an iron butterfly centered at 755 with $7 wide wings:
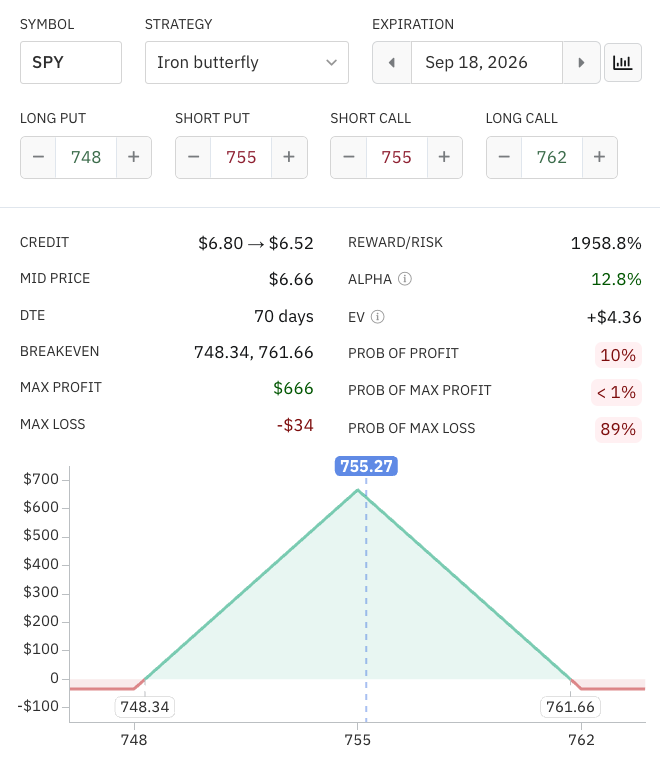
Current pricing yields a premium of $666. A position size of one contract has a max profit of $666 and a max loss of -$34 (if SPY closes below 748 or above 762 at expiration).
The position has a probability of profit of only 10%. But with a R/R of 1958%, it has a +EV of $4.36.
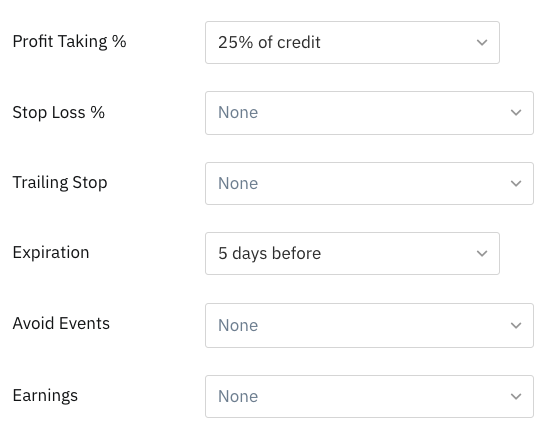
Adding Exit Options will monitor and manage the position for profit taking, stop losses, expiration, and more.
For example, this trade would be closed at a 25% profit or 5 days before expiration, whichever comes first:
|
Ready to build your trading plan? 
|


'%3e%3cg id='Final-Copy-2_2_' transform='translate(1275.000000, 200.000000)'%3e%3cpath class='st0' d='M7.4,12.8h6.8l3.1-11.6H7.4C4.2,1.2,1.6,3.8,1.6,7S4.2,12.8,7.4,12.8z'/%3e%3c/g%3e%3c/g%3e%3c/g%3e%3cg id='final---dec.11-2020'%3e%3cg id='_x30_208-our-toggle' transform='translate(-1275.000000, -200.000000)'%3e%3cg id='Final-Copy-2' transform='translate(1275.000000, 200.000000)'%3e%3cpath class='st1' d='M22.6,0H7.4c-3.9,0-7,3.1-7,7s3.1,7,7,7h15.2c3.9,0,7-3.1,7-7S26.4,0,22.6,0z M1.6,7c0-3.2,2.6-5.8,5.8-5.8 h9.9l-3.1,11.6H7.4C4.2,12.8,1.6,10.2,1.6,7z'/%3e%3cpath id='x' class='st2' d='M24.6,4c0.2,0.2,0.2,0.6,0,0.8l0,0L22.5,7l2.2,2.2c0.2,0.2,0.2,0.6,0,0.8c-0.2,0.2-0.6,0.2-0.8,0 l0,0l-2.2-2.2L19.5,10c-0.2,0.2-0.6,0.2-0.8,0c-0.2-0.2-0.2-0.6,0-0.8l0,0L20.8,7l-2.2-2.2c-0.2-0.2-0.2-0.6,0-0.8 c0.2-0.2,0.6-0.2,0.8,0l0,0l2.2,2.2L23.8,4C24,3.8,24.4,3.8,24.6,4z'/%3e%3cpath id='y' class='st3' d='M12.7,4.1c0.2,0.2,0.3,0.6,0.1,0.8l0,0L8.6,9.8C8.5,9.9,8.4,10,8.3,10c-0.2,0.1-0.5,0.1-0.7-0.1l0,0 L5.4,7.7c-0.2-0.2-0.2-0.6,0-0.8c0.2-0.2,0.6-0.2,0.8,0l0,0L8,8.6l3.8-4.5C12,3.9,12.4,3.9,12.7,4.1z'/%3e%3c/g%3e%3c/g%3e%3c/g%3e%3c/g%3e%3c/svg%3e) Your Privacy Choices
Your Privacy Choices